Self-Organized Sparse Distributed Memory -- an Application
František Grebeníček
grebenic@dcse.fee.vutbr.cz
Abstract
This paper discuses an extension of Kanerva's Sparse Distributed Memory (SDM) and introduces possible application in storage and retrieval sequences (predicting). A self-organizing SDM equivalent to a three-layered neural network is used to learn the desired transfer function mapping a sequence (history) of 2D points to next point. The net was tested in simple experiment, where some kinds of Lissajous curves was successfully stored and retrieved.
Introduction
- Associative memory
Associative memory is a memory that can recall data when a reference address is sufficiently closed (not only exact equal as in random-access memories) to the address at which the data were stored. It is very useful if the reference address is corrupted by random noise or outright errors or if this address is only partially specified.
- Sparse Distributed Memory (SDM)
The SDM was developed by Kanerva and it may be regarded either as an extension of a classical random-access memory (RAM) or as a special type of three layer feedforward neural network. The main SDM alterations to the RAM are:
- The SDM calculates Hamming distances between the reference address and each location address. For each distance which is less or equal to the given radius the corresponding location is selected.
- The own memory is represented by
 counters (where n is number of locations and m is the input data length) instead of single-bit storage elements.
- Writing to the memory, instead of overwriting, is as follows:
- if the i-bit of the input data is 1, the corresponding counters (counters in the selected locations (rows) and in the i-th columns) are incremented,
- if the i-bit of the input data is 0, the corresponding counters are decremented.
- Reading (or recall) from the memory is similar:
- The contents of the selected locations are summed columnwise.
- Each sum is thresholded. If the sum is greater than or equal to the threshold value the corresponding output bit is set to 1, in the opposite case it is cleared. Note that the thresholds may be zero, if the training input vectors are closed to orthogonal ones.
SDM implements transformation from logical space to physical space using distributed data storing. A value corresponding to a logical address is stored into many physical addresses. This way of storing is robust and not deterministic. A memory cell is not addressed directly. If input data (logical addresses) are partially damaged at all, we can get correct output data.
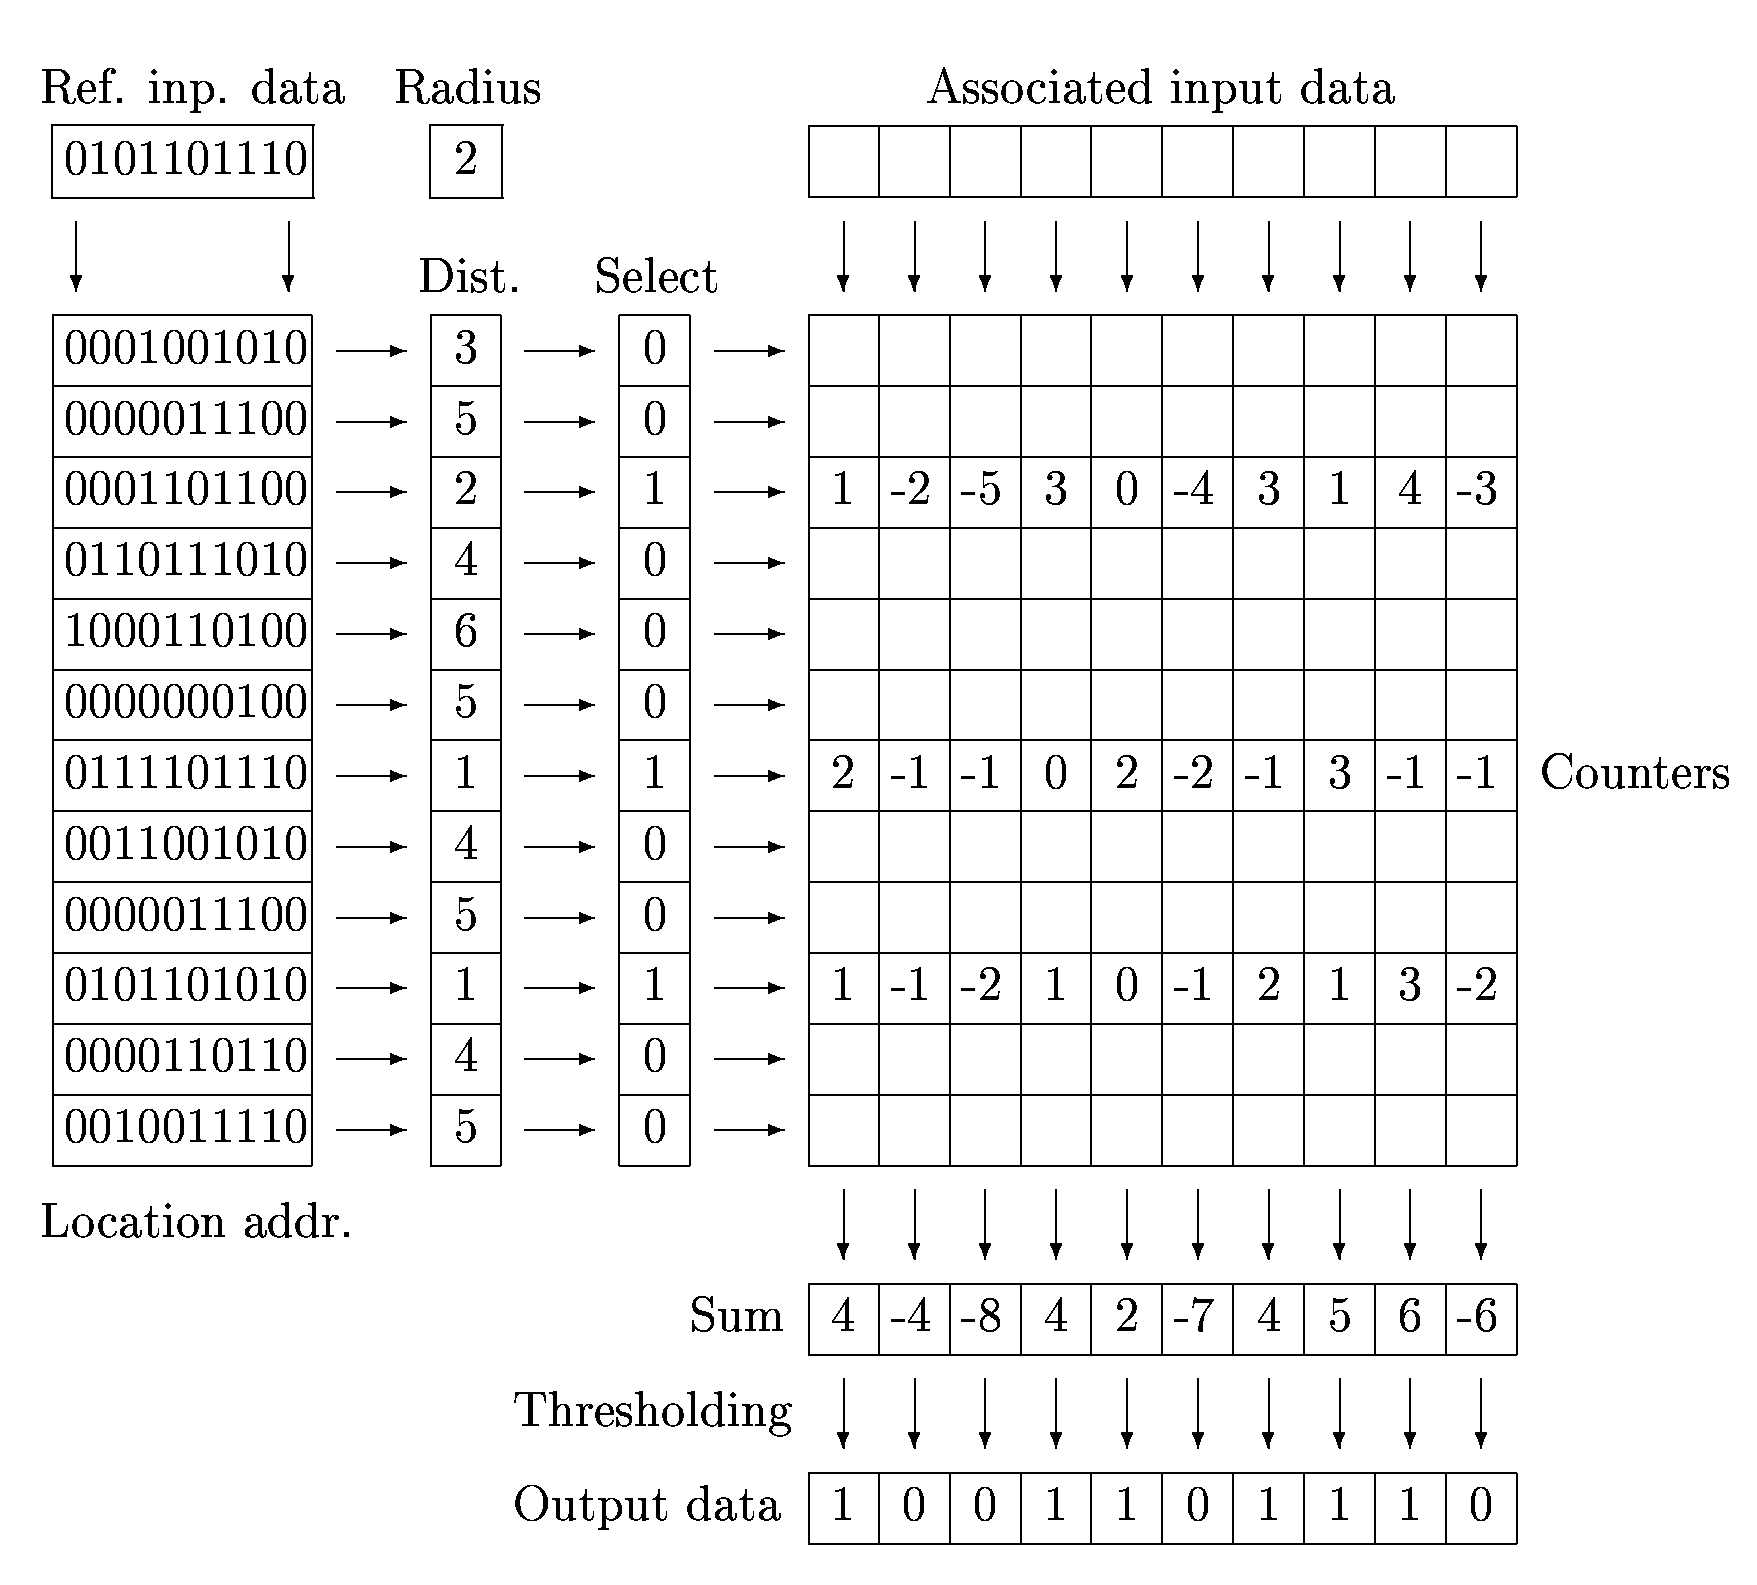
Figure 1: SDM as an extesion of RAM
- Limitations of Kanerva#s Model
The model of sparse distributed memory as originally proposed by Kanerva has several weaknesses:
- Both the address and data vectors are required to be binary in the standard model of the SDM. Since most natural environments yield multivalued input patterns, we must either modify the indexing mechanisms of the model or recode all inputs into binary form. We chose the former option since the latter sacrifices the interpolation properties of the memory.
- The standard model of the SDM assumes a uniform distribution for the input address vectors whereas in most natural circumstances, the input vectors tend to be clustered in many correlated groups distributed over a large portion of the multidimensional address space. Therefore, if addresses are picked randomly as suggested by Kanerva, a large number of locations will never be activated while a number of locations will be selected so often that their contents will resemble noise. We remedy this situation by allowing the input space to self-organize.
- The standard SDM uses a single fixed threshold (radius) for activating address locations. While this simplifies the analysis of the memory considerably, it also results in poor performance since the actual values of the distances between an input address vector and the basis address vectors in the SDM are lost during quantization to 0 or 1. Model in [7]. uses radial interpolation functions that weight corresponding data vectors according to the address vector#s closeness to the input vector.
Self-Organizing SDM
In the following, we describe some modifications of standard model of the SDM. We inspect some ways to allow the input address space to self-organize according to input distribution.
- Fixed Location Addresses with Non-Uniform Distribution
In this case location addresses are generated during the net initialization phase according to training patterns. The algorithm can be described as follows:
For each pattern generate given number of location addresses which lie inside given radius. We can use uniform distribution inside radius. It is similar to adding a random noise to the patterns. Another way to do this follows: for each location address and given radius R generate a set of R random integers from interval <
0, address_width # 1>
. Then, each integer from the set means the change (inversion) of i-th address bit. And generate given number of location addresses for each pattern in this manner.
After initialization, memory works like the standard Kanerva#s SDM. This modification of SDM was described in [4,5] and tested in image recognition. There is also possibility of using normal distribution for generating location addresses, but it has not been tested yet.
- Competitive Learning of Location Addresses
In the following, we describe the operation of a modified form of SDM (Self-Organizing SDM, SO SDM). The memory can be realized as a three-layer fully-connected feedforward network. Assume the memory contains m storage locations. The first layer consists of n units representing the input perception vector p. The hidden layer consists of m units while the output layer is represented by k units. Let wi (1 <=
i <=
m) represent the vector of weights between hidden unit i and the input layer, and let mi represent the vector of weights between hidden unit i and the output layer. The memory accepts multivalued perception vectors p from an arbitrary distribution and stores an associated multivalued motor vector m in a distributed manner in the data space.
- Initialization
Pick m unique addresses (n-dimensional vectors pi) at random for each of the locations. This corresponds to randomly initializing the input-hidden weight vectors wi (1 <= i <= m).
- Competitive Learning
Given an input perception vector p and an associated motor vector m during the training phase, we self-organize the address/data space using a soft competitive learning rule [7]:
- Calculate the Euclidean distances dj = |
|
wjt # p|
|
between wjt and the input perception vector p.
- Adapt all weight vectors (location addresses) according to:
|
wjt+1 = wjt + gj(t)Pt(dj)(p # wjt ) |
(1) |
where Pt is defined as:
|
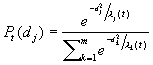
|
(2) |
and gj is given by gj(t) = 1/nj(t) where the counter:
|
nj(t+1) = nj(t) + Pt(dj)
nj(t=0) = 1 |
(3) |
Pt(dj) can be interpreted as the probability of the prototype vector wj winning the current competition for perception p. Note that the probability vector P obtained by vectorizing the Pt(dj) for 1 <=
i <=
m is the equivalent of the select vector in Kanerva#s model (Figure 1).
The #temperature# parameter l
j(t) is gradually decreased to a small value in a manner reminiscent of simulated annealing. This causes the learning algorithm to evolve from an initially soft form of competition with a large number of winners to the case where only a sparse number of winners exist for any given input vector. The soft competition in the beginning tunes the initially random prototype vectors towards the input space (thereby preventing the occurrence of #dead# units which never get updated) while the later existence of sparse number of winners helps in fine tuning the prototype vectors to form a set of distributed basis vectors spanning the input space.
- Given a training data m, adapt the prototype vectors stored in the motor space according to equation (1) using the same values for dj as in (1) above (i.e. distance between the input perception vector p and the sensory basis vectors wjt):
|
mjt+1 = mjt + b
j(t)Pt(dj)(m # mjt ) |
(4) |
where b
j(t) (0 <
b
j(t) <
1) is a gain function. Note that b
j(t) does not necessarily have to decrease with time (this reinforcement strength could be made to depend on other factors such as importance to animate system as evaluated by other modalities or other internal value mechanisms).
- Computing Output Vectors
Following training, the memory interpolates between the stored basis vectors to produce an output vector o for a given perception vector p, as follows:
- Calculate the Euclidean distances dj = |
|
wjt # p|
|
between wjt and the input perception vector p.
- Let mji (1 <=
i <=
k) denote the weight from hidden unit j to output unit i. Then, the i-th component of the reconstructed output vector o (in other words, the output of the output unit i) is given by:
|
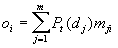
|
(5) |
The saliency-based weighted averaging above is a form of normalized radial interpolation that is similar to the output operation of radial basis function (RBF) networks [8]: the closer the current input is to a given location address, the more #salient# that memory location and the more the weight assigned to the counter vector associated with that location address.
Experiment
Experiment application was written in Java language using java.awt package and compiled by Sun JDK 1.1.6.
- Experiment Data
Two-dimensional Lissajous curves was used as training patterns. The coordinates was computed as follows:
|
yj = sin(f1×
2p
×
j/N) |
(6) |
|
xj = cos(f2×
2p
×
j/N) |
(7) |
where f1, f2 are frequencies, N is resolution and j = 1..N+1.
We used a sequence of five points (from end of history) to compose a training pattern. The first four points was used as the address and the last point was used as data. Similarly we made the address for reading a next point from the memory.
| |
address |
data |
= training pattern |
|
Sequence of |
x1 |
x2 |
x3 |
x4 |
x5 |
|
|
coordinates |
y1 |
y2 |
y3 |
y4 |
y5 |
|
| |
|
address |
for reading prediction |
Figure 2: Experiment data
- Used Memory
We have used self-organizing sparse distributed memory with competitive learning of location addresses. Parameters of the memory: address width 8 real numbers, data width 2 real numbers, location count (number of hidden units, m) 100, gain function b
j(t) = 0.5 was constant during experiment. Location addresses was randomly initialized in the space <
-1,1>
8 (see section 2.2.1). Data in the training patterns was scaled to be inside interval <
-1,1>
. The temperature parameter l
j(t) was gradually decreased from 1.0 to 0.01 during experiment.
- Results
The memory was tested using various types of Lissajouse curves. Tests was done in following algorithm:
- Write the sequence of points (i.e. all curve) to the memory.
- Generate a starting sequence (i.e. history of five points).
- Compose address from the starting sequence and read next point from memory (prediction).
- Add the point to end of the sequence (history) and go to step 3. This infinite loop can be broken by operator, parameters of the memory (especially temperature) can be changed and the writing can be repeated many times.
The results of some tests are shown below:
- Circle
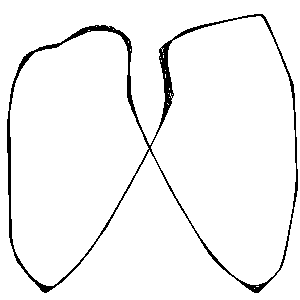
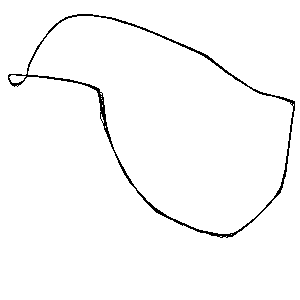
If frequencies f1, f2 equals (f1 = f2), formulas (6) and (7) produces circular line. That is why, circle is Lissajouse curve too. In this test, both frequencies was set to 3 and resolution equaled 100. It means that line run around circle three times. Temperature was set to 0.5 and stayed constant during test.
 |
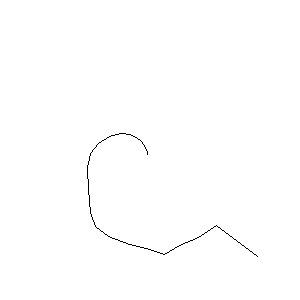 |
 |
 |
| a) pattern circle |
b) once written |
c) twice written |
d) finished learning |
Figure 3: Circle test - memory responses
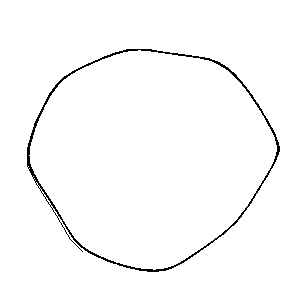
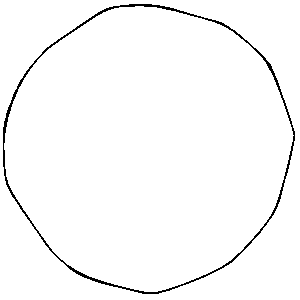
- Lissajouse curve 2:1
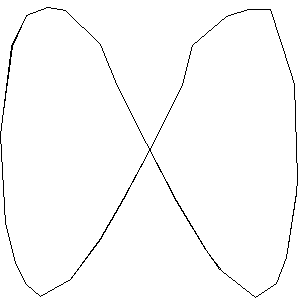
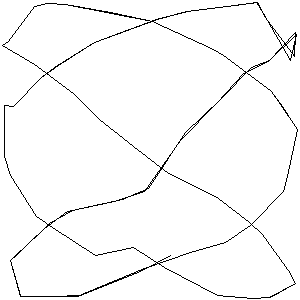
Frequencies was set: f1 = 6, f2 = 3, resolution equaled 100. Temperature decreased from 0.5 to 0.1 during test process.
 |
 |
 |
 |
| a) pattern curve |
b) three times written |
c) temperature decreased |
d) finished learning |
Figure 4: Lissajouse test 2:1 - memory responses
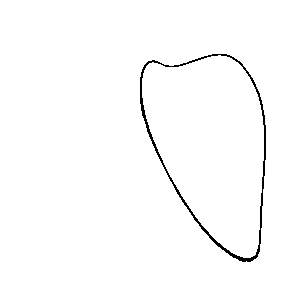
- Lissajouse curve 2:3
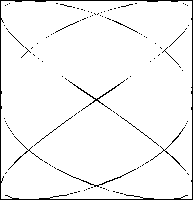
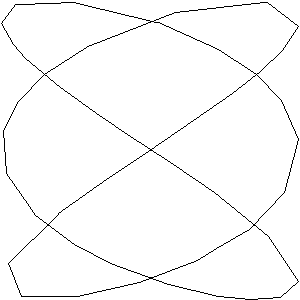
Frequencies: f1 = 6, f2 = 9, resolution: 200. Temperature decreased from 0.5 to 0.01.
 |
 |
 |
 |
 |
| a) pattern curve |
b) |
c) |
d) |
e) finished learning |
Figure 5: Lissajouse test 2:3 - memory responses
Conclusions
The results of the experiment have shown that a Self-Organized Sparse Distributed Memory provides an efficient platform for storing and retrieving sequences. The aim of the experiment is a trajectory tracking. The proposed methods can be applied to more complex problems, like motion capturing. In the motion capturing there are many trajectories by an image and many of them intersect together or are broken.
This project was supported by the GACR grant No. 102/98/0552 (Research and Applications of Heterogenous Models).
References
- Kanerva, Pentti: Sparse Distributed Memory, The MIT Press 1988.
- Rogers, D.: Kanerva#s sparse distributed memory: An associative memory algorithm well-suited to the Connection Machine. In Proc. Conference on Scientific Application of the connection machine, Moffet Field, CA, 1988, Vol.1, 282-298.
- Cibulka, J.: Sparse Distributed Memory: An Analysis, Proceedings of the ASIS#97, Krnov, 1997
- Zbořil, F., Cibulka, J., Grebeníček, F.: Neuronové asociativní paměti, In: Final technical report FR VŠ 627/97, Brno, 1997
- Zbořil, F.: Sparse Distributed Memory and Restricted Coulomb Energy Classifier, In: Proceedings of the MOSIS'98, MARQ, Ostrava, Sv. Hostýn - Bystřice pod Hostýnem, 1998, s. 171 # 176
- Grebeníček, F.: Data coding for SDM, In: Mosis'98 Proceedings, FEI VUT Brno, Hostýn, Czech Republic, 1998, Vol. 1, 149-154
- Rao, Rajesh P. N., Fuentes, Olac: Learning Navigational Behaviours using a Predictive Sparse Distributed Memory, Proceedings of From Animals to Animats: The Fourth International Conference on Simulation of Adaptive Behavior, MIT Press, 1996.
- Poggio, T., Girosi, F.: Networks for approximation and learning, Proc. IEEE, 78: 1481#1497, 1990